

How it all started...
What inspired its creator
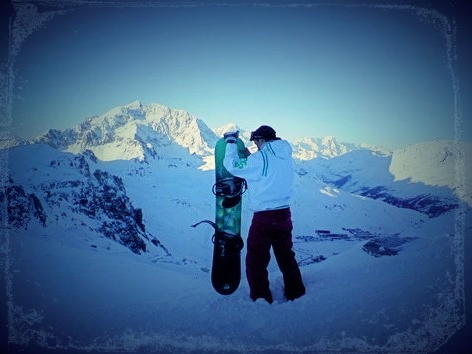
Growing up in Glasgow with the Highland's of Scotland less than an hours drive away, SJ and his friends embraced life head on,
whether it was Surfing, Snowboarding, Mountain climbing or camping in the wilderness, enjoying life and creating memories
was a regular part of their lives...
But as they grew older the reality of life started to kick in, days like those became rarer.
Friends moved away for Uni, started families and careers, which meant there wasn't much time to spend doing what they used to love. Soon days would
blend into the next, repetitive, mundane, before they knew it they were like everyone else "living in the real world" Then one day SJ
was Inspired by a Ted Talk he saw where the speaker talked about
how little we actually live compared to merely existing. The speaker said that if we were somehow able to quantify our days lived and lost,
it would have a profound effect on how we view life and motivate us to change for the better whilst we still can. So he
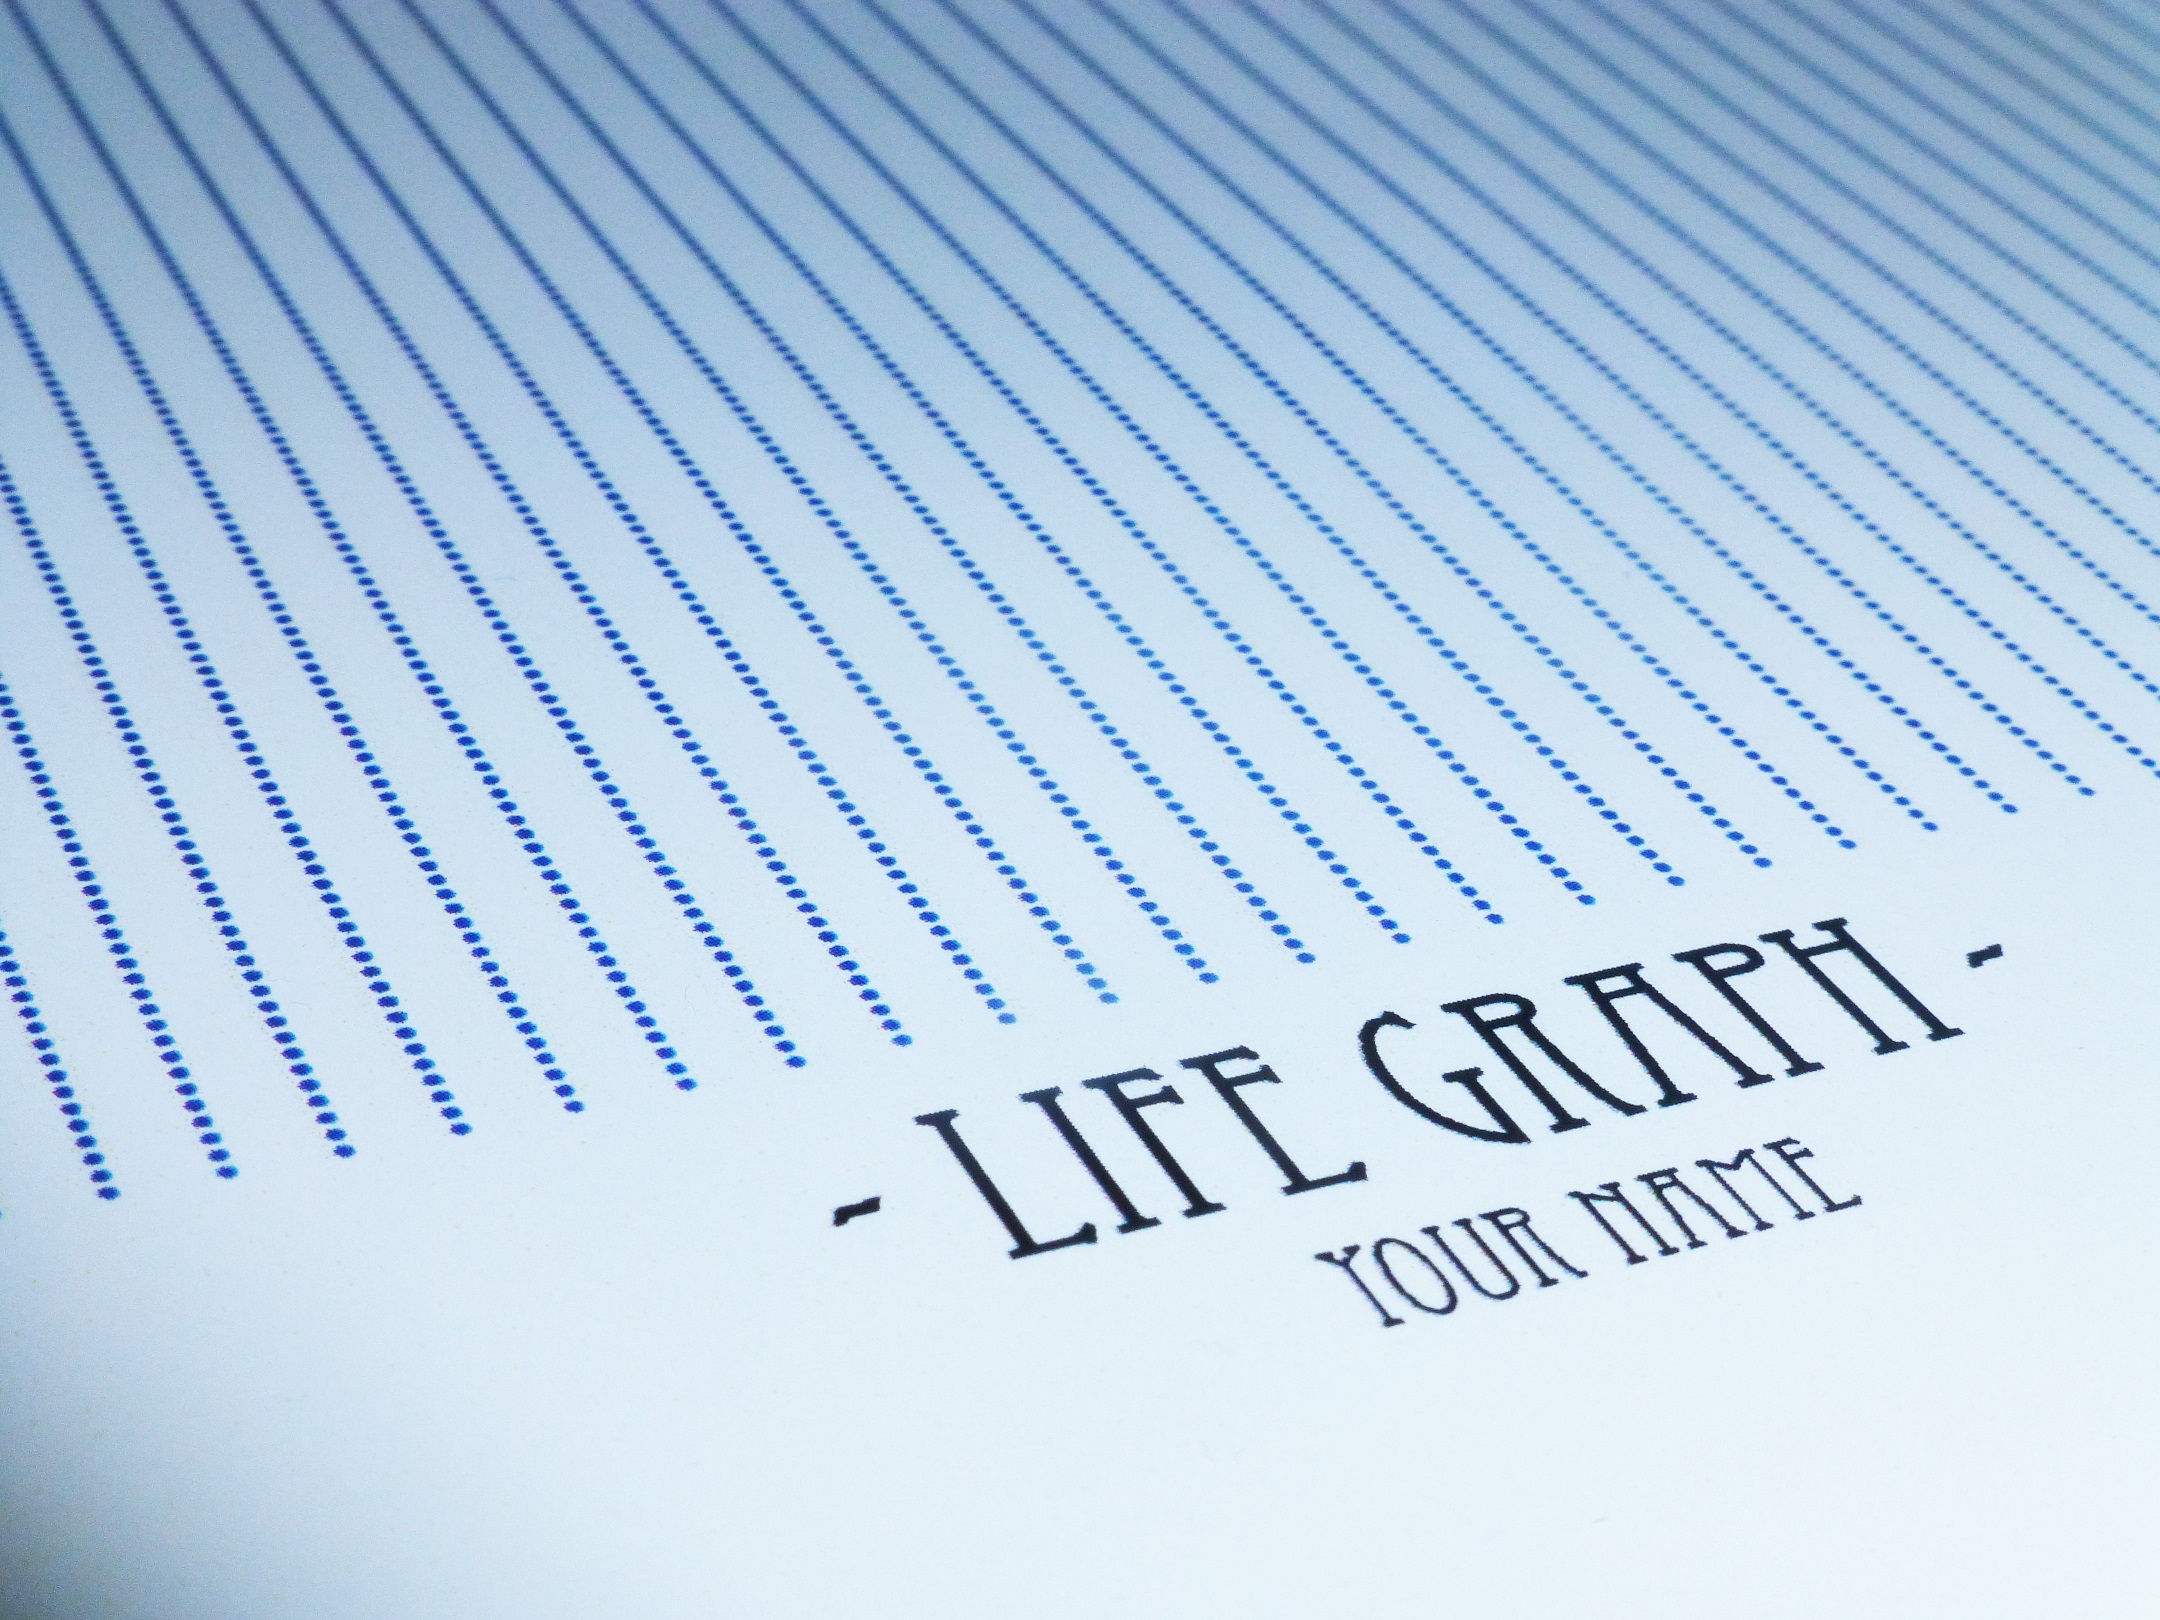
designed and built a simulation program called 'LifeGraph' which creates uniquely bespoke and eye-opening works of motivational art to help inspire people "Living in the real world"
and lets them know that time, really is running out.
What We Do...
The process
- Choose Size:
30x42cm (A3) = £100
42x60cm (A2) = £130 - Be Brutally Honest about the information you send us
- We Pair that data with our Simulation program to produce your unique Life Graph
- Your name will be at the bottom, but the days lived and lost will also be yours
- We post it to you, for Free
- Let the results sink in and claim your life back!
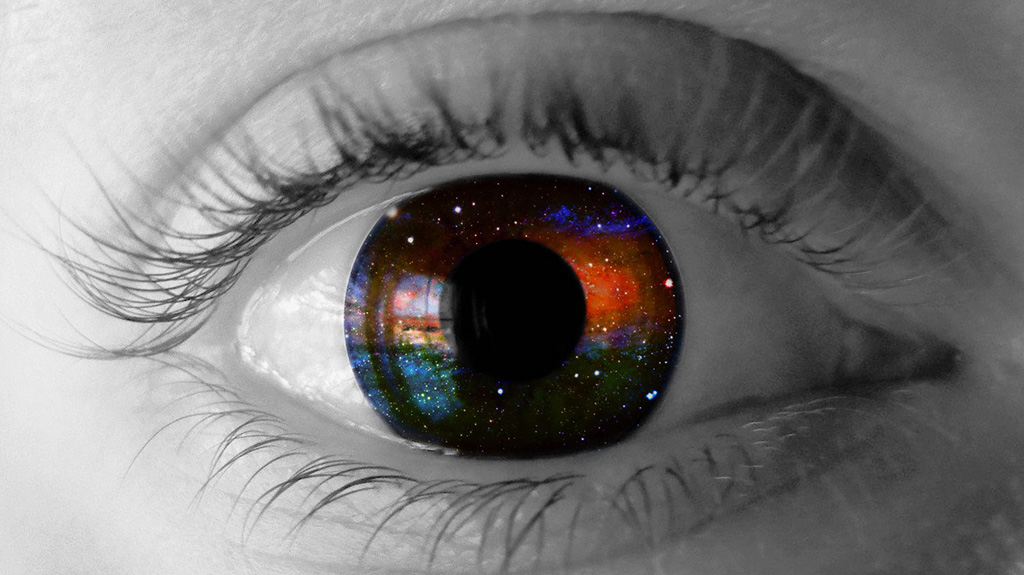
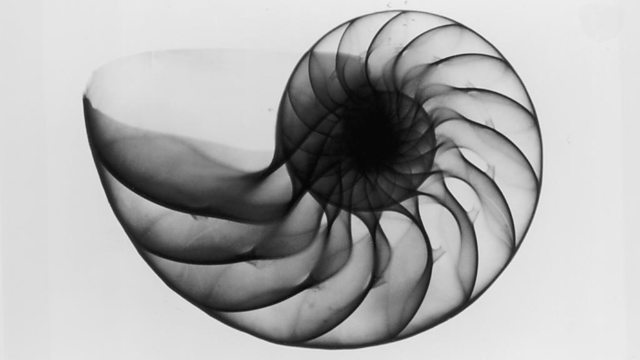
Pic of the Month...
Pictures from around the Web that make you think...
-
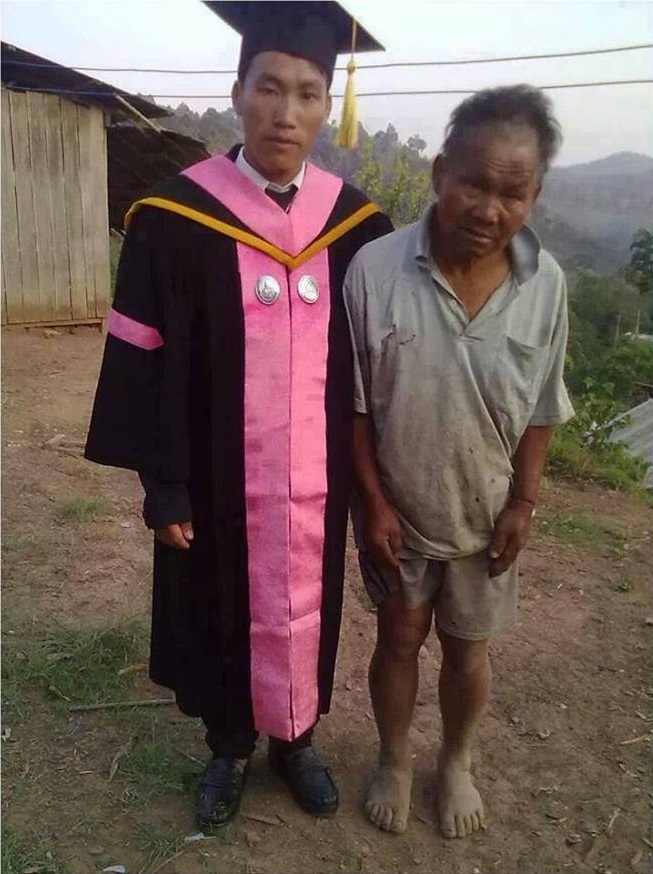
Feb...
-
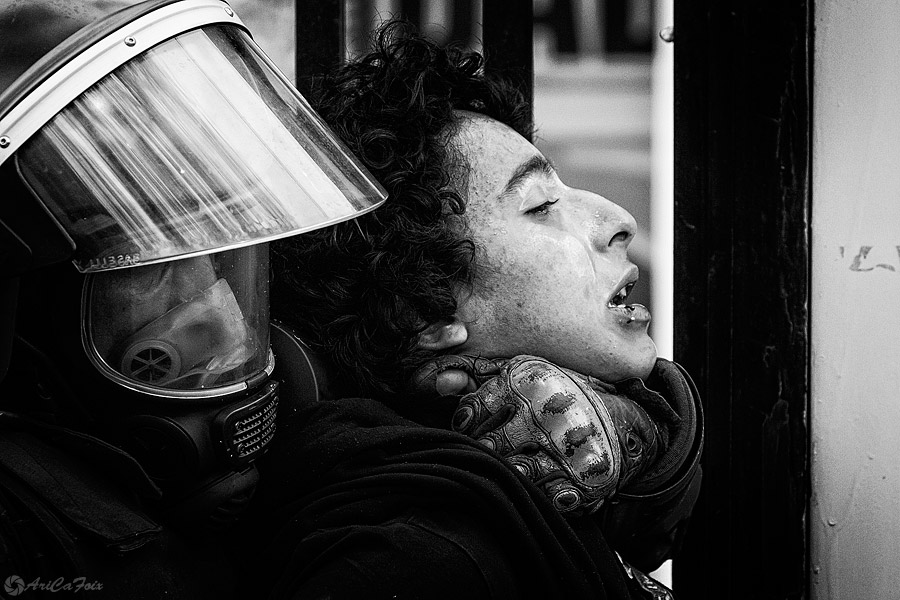
Jan...
-

Dec...